Current visualisations for live music performance do not take into account audience members' perception and reaction to the music. MoodVisualiser is an audience/performer interactive system generating real-time visuals which are both music- and audience-related. We use the e-Health biometric sensor platform which works with the Arduino framework to measure factors related to some of the listeners' emotions. For instance, we use the skin conductance response (SCR) which correlates with emotional arousal based on the amount of sweat secreted by the skin. We also use the pulse which can vary if audience members stay still or are dancing. Visualisations are produced using the Processing framework. Although the prototype has been developed with a single sensor device, we plan to experiment in the future with multiple sensors using wireless technology to account for a wider number of audience members.
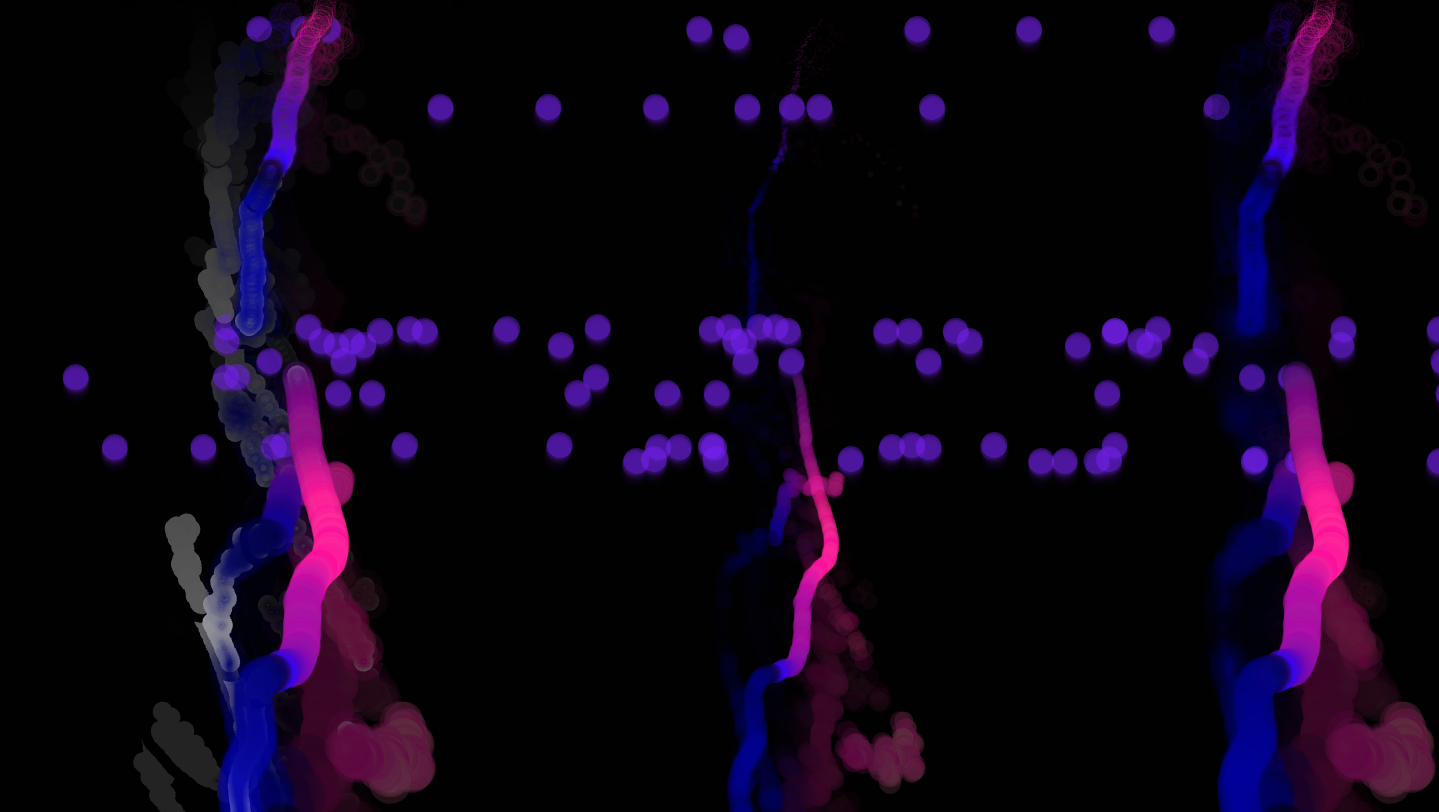
Screenshot from Music Hack Day Barcelona / Sonar 2014:
In the visualisation example below, the amount and fluctuations of the bubbles are related to listeners' emotional arousal, as characterised by the SCR signals. The size of the bubbles are linked to pulse measurements.

Links
Music Hack Day Barcelona Twitter feed
If you are interested in the project, please contact us:
Mathieu Barthet (m.barthet@qmul.ac.uk)
George Fazekas (gyorgy.fazeaks@eecs.qmul.ac.uk)
Qi Gong
(Centre for Digital Music (http://c4dm.eecs.qmul.ac.uk/) & Media and Arts Technology programme (http://www.mat.qmul.ac.uk/) at Queen Mary University of London)